A toolkit for soiling detection in PV parks
Soiling is the accumulation of dirt on the surface of the solar panels, which results in a gradual loss of solar energy production. To reduce the effect of soiling, panels must be cleaned on strategically chosen dates to reduce the cost induced by energy loss while taking into account cleaning costs. The problem is quite challenging because soiling monitoring systems are often considered unreliable or costly. Ideally, decisions are to be taken based only on measurements of a minimal number of variables, which are considered reliable, e.g., power output, irradiance, module temperature, and precipitation. Therefore, accurately quantifying soiling loss is an important step towards mitigating the financial loss caused by the under-performance of solar panels due to soiling. We have developed a framework that operates on a time series defined by a minimal set of variables measured by the sensors of a solar park and extracts models that accurately predict losses due to soiling. These models can be used in historical data to detect time periods during which power production was severely affected by soiling. Detecting such periods can assist the parks' administrators in efficiently planning future cleanings of the park. Moreover, these models can be used in a real-time scenario where the park administrators can detect in real-time that the production loss is severe, and a manual cleaning must be scheduled immediately.
Our approach works in two steps: we first detect cleaning events in the input time series, i.e., we classify rains or manual cleanings, which effectively wash the solar panels. Then, using these cleaning events, we define periods that represent the "clean" performance of solar panels, and we use them for training regression models capturing the power yield of clean solar panels. The main advantages of our approach are that it does not require labeled data, is not based on the accuracy of an analytical formula for the optimal energy output of the park, and is agnostic to the type of solar panels employed. It requires no knowledge about the model-specific parameters and the specifications associated with the solar panels. As a purely data-driven approach, it solely depends on the availability of data, particularly a minimal set of generally available variables. Moreover, the proposed method exhibits multi-fold functionality; it identifies cleaning events, models the real expected power output, i.e., power output when solar panels are clean, and can also compute a ranked list of time periods with severe soiling losses. Our experiments indicate that our models are more accurate in predicting "clean" power output than standard generic analytical formulas, which constitute the main alternative modeling approach that is agnostic to the type of solar panels.
The problem of detecting cleaning events can be viewed as a problem of detecting changepoints with respect to the power output of solar panels, i.e., rapid changes in its behavior, as a function of the irradiance and the module temperature. We propose two methods for changepoint detection. Our solutions aim to verify candidate changepoints in a time series as follows: given a set of segments of the input time series corresponding to time periods where a changepoint may lie, our tool assigns scores to those segments, which represents the possibility of containing a changepoint. In our particular use case, the time periods where changepoints may lie correspond to raining periods or periods during which the solar panels were manually cleaned. In our first method, each segment is processed as follows:
- We fit a regression model on the data contained in a time interval before the assumed changepoint.
- We validate it on a time interval before the assumed changepoint.
- We make predictions on a time interval after the assumed changepoint.
In our second model, we assume a minimal set of labeled points as input. These points correspond to timestamps where the solar panels were certainly clean, e.g., the measurements following manual cleanings. We extend these points to intervals of a user-defined length w, i.e., for a manual cleaning ending at timestamp t, we consider the whole interval [t,t+w], and we use all points in the resulting intervals as our training set. The intuition is that during such periods of time, the target variable typically behaves as expected; therefore, the regression model captures the target variable's expected behavior. In order to detect changepoints, we make predictions before and after each segment, and we assign higher scores to those segments which satisfy the following: i) the prediction error for a time period succeeding the given segment is small, and ii) the prediction error for a time period preceding the given segment is large. The two methods, apart from being slightly different in concept, also have different requirements regarding the accessible data. The first method is self-supervised since it translates the original problem to a supervised one, based on the following observation: if there is a changepoint in a sufficiently short segment, then it should be that the target variable deviates from its expected behavior in the preceding (resp. succeeding) period of time. On the other hand, the second method is semi-supervised, because it exploits the minimal information provided in the form of a minimal set of labeled points. Detected cleaning events are then used to train regression models, which represent the expected power output of clean solar panels. In particular, we define intervals following the changepoints that are detected by either of the above two methods or intervals following manual cleanings, using a user-defined length w, and we train the regression model on the set of points in the resulting intervals. Using these models, we can estimate the soiling ratio, i.e., the ratio between the actual power output and the expected power output.
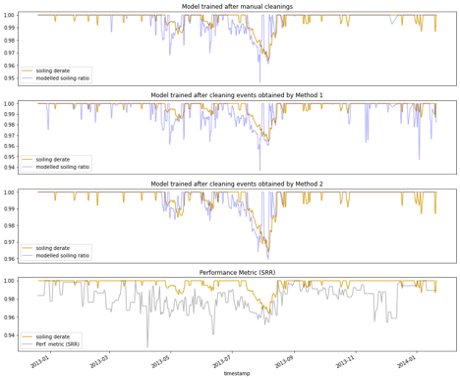
To evaluate our method, we have used a publicly available dataset that contains a set of currentvoltage (I-V) curves and associated meteorological data for solar panels in three different locations and climates for approximately one-year periods. For each location, we are given values for a normalized metric, called soiling derate, which compares the daily performance of a solar panel to an identical solar panel that is cleaned during daily maintenance. We compare soiling derate with the corresponding performance index induced by our methods and a performance index that is based on an analytical formula, as employed by the stochastic rate and recovery (SRR) method, which is a state-of-the-art method for quantifying soiling loss. Our experiments, as in Figure 1, show that our method achieves higher accuracy in predicting daily losses due to soiling compared to the other alternative.
- Find more about the novel experimental evaluation of changepoint and deviation detection methods:
https://github.com/MORE-EU/complex-event-detection/blob/main/notebooks/soiling_experiments/deviation_detection_labelled.ipynb - Examine our experiment based on real use case data:
https://github.com/MORE-EU/complex-event-detection/blob/main/notebooks/soiling_experiments/deviation_detection_real.ipynb
ModelarDB: Managing Extreme-Scale Time Series from Wind and Solar Parks Using Models
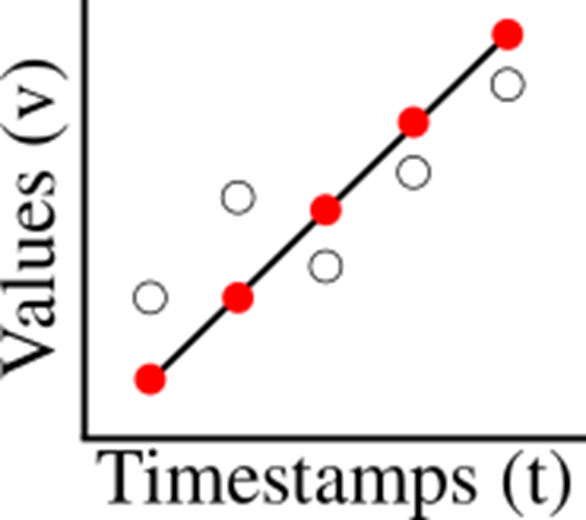
ModelarDB is an efficient Time Series Management System (TSMS) for high-frequency sensor time series. ModelarDB provides state-of-the-art lossless and lossy compression and query performance by representing time series using different types of so-called models such as constant and linear functions. We use the term model for any representation of a time series from which the original time series can be recreated within a known error bound (possibly 0%). For example, the linear function v = a * t + b can represent an increasing, decreasing, or constant time series and reduces storage requirements from one value per data point to only two values: a and b. This is illustrated in the figure below where the original data points are white circles, the linear function is a black line, and the reconstructed data points are red points:
As the structure of the time series being compressed changes over time, ModelarDB automatically and dynamically switches between different model types to accommodate. The compressed time series can be efficiently queried using a relational interface and SQL without any knowledge about the model-based representation. ModelarDB’s query optimizer automatically rewrites the queries to exploit the model-based representation.
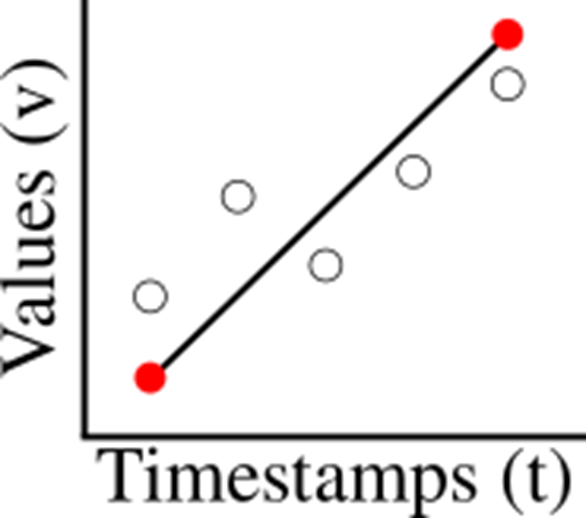
From a user’s perspective, ModelarDB stores time series as tables where each row contains a timestamp, fields (i.e., measured values such as temperature, pressure, and humidity), and tags (i.e., describing attributes such as location, manufacturer, and manufacturing year). At the physical level, ModelarDB stores the time series in a very efficient manner by using models as described above. These models can recreate the original values so arbitrary queries can be answered and many queries can even be answered more efficiently directly from the models. For example, for the time series shown in the figure above, a query could ask for the SUM of the values. A naïve way to do that requires reconstruction of every data point. For regular times series, ModelarDB, however, only reconstructs the first and last data point, as illustrated in the figure below, and can then compute the SUM directly from those. This is much more efficient and contributes to ModelarDB’s high query performance.
To further reduce the amount of storage required, the user can optionally specify an error bound for each field. This allows ModelarDB to perform lossy compression such that the models approximate the values within the error bound. The error bound can also be set to 0% in which case ModelarDB does lossless compression. A 0% error bound is the default.
The first research prototype of ModelarDB already demonstrated significantly better compression than systems widely used in industry (see the table below).
| Storage Method | Size (Gib) |
|---|---|
| PostrgeSQL 10.1 | 782.87 |
| RDBMS-X - Row | 367.89 |
| RDBMS-X - Column | 166.83 |
| InfluxDB 1.4.2 - Tags | 4.33 |
| InfluxDB 1.4.2 - Measurements | 4.33 |
| Storage Method | Size (Gib) |
|---|---|
| CSV Files | 562.68 |
| Apache Parquet Files | 106.94 |
| Apache ORC Files | 13.50 |
| Apache Cassandra 3.9 | 111.89 |
| ModelarDB | 2.41 - 2.84 |
Since then, more functionality has been added to ModelarDB to provide even better compression. For example, compression of similar time series as one stream of models and avoiding storing derivable time series physically. Thus, compared to widely used formats, ModelarDB currently provides up to 13.7x faster ingestion, 113x better compression, 573x faster aggregate queries. Further, ModelarDB scales close to linearly as more data and nodes are added.
ModelarDB is designed to be deployed both on the edge (e.g., on wind turbines) and on the cloud (e.g., on Microsoft Azure). Data is efficiently ingested and compressed using the different types of models already on the edge and can immediately be queried for low-latency analytics. Depending on the available bandwidth, data amounts, and analytical needs, the compressed data is later transferred to the cloud where further compression can take place by exploiting similarities between data from multiple edge nodes. This combination of edge and cloud deployment makes it possible for ModelarDB to provide both low-latency queries and practically unlimited scalability.
The latest version of ModelarDB is designed to be cross-platform and is continuously tested on Microsoft Windows, macOS, and Ubuntu. It is implemented in Rust and uses Apache Arrow Flight for communicating with clients, Apache Arrow DataFusion as its query engine, Apache Arrow as its in-memory data format, and Apache Parquet as its on-disk data format.
ModelarDB is an open-source project and is licensed under version 2.0 of the Apache License. The source code, test cases, and documentation are available at https://github.com/ModelarData/ModelarDB-RS
Α Self Service Visualization Platform for Renewable Energy Analytics
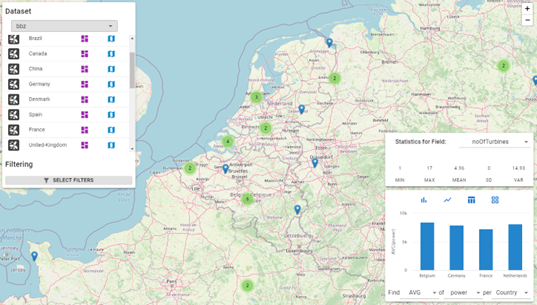
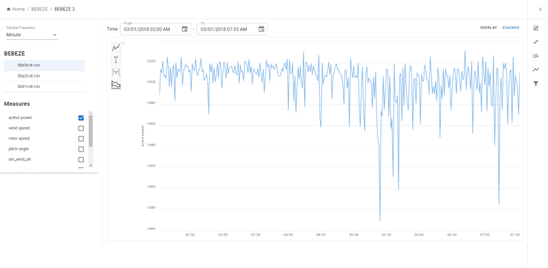
The Self Service Visualization Platform for Renewable Energy Analytics is a visual analytics platform for business users from the Renewable Energy Sources (RES) sector to interact with big geo-located time-series data collected from wind turbines and solar panels. The platform offers real-time visual analytics at the macroscale (e.g., park KPIs on a map) and microscale (e.g., analysis of multivariate time series from multiple sensors of a single wind turbine), through a dashboard-like UI, and informs users on various KPIs and important events in real time.
One of the main innovations of the platform is the provision of an intuitive UI that combines exploration of renewable assets on a map with a time-series visualization Dashboard for analyzing the measurements coming from RES sensors; the UI allows users to first navigate on a map and select the wind or solar park, they wish to explore and view statistics aggregated on the park level. Selecting a specific turbine or solar panel, they can start exploring the measurements collected by the mounted sensors in the form of a multivariate time series. The UI for time-series visualization and interaction offers functionality for visualizing and exploring RES sensor data, viewing the dashboard of a RES from the same farm, filtering the time-series data, highlighting intervals and data points of interest, comparing data from different RES and finding and visualizing patterns and complex events. Besides exploring historical RES time-series data, the platform supports the monitoring of RES performance through the visualization of several KPIs, as well as the real-time alerting of detected anomalies or events with a negative impact on performance and operation. For example, in the case of a solar panel, the accumulation of dust and debris on its surface can result in a gradual loss of solar conversion efficiency. Through the platform, a soiling event can be reported when the cost of washing the panel is less than its energy loss. Similarly, in the case of wind farms, incidents like yaw misalignment that leads to reduced turbine performance can be reported once detected. To further support the monitoring and timely identification of potential problems, users can enable the visualization of forecasted data for the KPIs they currently view.
A major challenge in the exploration and visualization of RES sensor data is how to enable users to perform interactive visual analysis of the data, especially considering their sheer size. To this end, the platform employs an in-memory adaptive indexing approach, which can scale up the visualization and enable real-time interactive exploration and analysis of millions of data points from energy sensors. The index is initialized based on the raw time-series data and maintains a hierarchical tree representation of it. To further empower the visual analytics component, an index adaptation approach is employed, such that the response time of future user operations is kept small based on a locality- based interaction of the user.
The positioning of the platform with respect to similar products and research prototypes in the field of RES data visualization lies in the following competitive advantages. First, the offered self-service capabilities allow users to explore and visually analyze RES time-series data directly over the raw data, while in-memory and adaptive indexing are used to achieve interactive query performance, even when dealing with millions of data points. At the same time, the platform combines historical RES data visualization with real-time performance monitoring and alerting any events detected.
Take a look at the tool’s source code:
https://github.com/MORE-EU/more-visual
Streams And Incremental Learning (SAIL)
High-volume and/or high-velocity data is increasingly being generated and analyzed, especially in domains like IoT and banking. Consequently, applications that require accurate real-time forecasts and predictions are also steadily increasing. Examples include very short-term forecasting for energy bidding, failure detection in manufacturing, or sentiment analysis on data from sources like Twitter.
Incremental machine learning algorithms provide an efficient approach for this type of data due to frequent concept drifts and noisy, often missing data. However, AutoML for incremental models can be a challenge. Unlike AutoML in batch learning algorithms, where the best model is chosen offline using a validation dataset and deployed for scoring, AutoML for incremental models requires dynamic and constantly updated to find the best model for a given concept. Similarly, dynamic ensembling, which is of great value for incremental models, requires that the base estimators' weights be regularly updated based on the motif of the incoming data. Dynamic AutoML workflows and ensembling for big data add an additional layer of difficulty as the models need to be computationally efficient while being robust to handle hyper-parameter optimization of multiple variants of incremental learning like online, continual, shallow, and deep learning models that highly vary in complexity.
Streams and Incremental Learning (SAIL) library (open source, MIT license) provides a common scikit-learn-based interface for multiple variants of incremental learning as mentioned above. It also provides ensembling options with batch learning models compared to existing libraries that keep batch and incremental models separate. Further, distributed computing for AutoML and ensembling within SAIL has been set up using Ray. The parallelization results in three major advantages that are particularly important for incremental models with high volume and high-velocity data:
- Faster computational times for ensemble models and forecasts.
- Faster computational times for dynamic AutoML algorithms
- Creates a clean interface for developing AutoML algorithms for incremental models.
To the best of our knowledge, there is no distributed framework for AutoML of incremental models. The work can be exploited in domains where high frequency, high volume data is becoming more prominent. In MORE, we discuss with Engie and Inaccess the applications of these models for their high-impact use cases.
Take a look at the SAIL library: https://github.com/IBM/sail